2023/24 UK higher education teaching staff digital experience insights survey findings
The digital experience insights survey for higher education teaching staff took place between October 2023 and June 2024. Participating universities were able to select their own survey period within these dates, typically a three to four week window.
There were 3,287 respondents from 33 different organisations (29 universities and four further colleges offering higher education degrees). 23 of these were based in England, four in Scotland, four in Wales and two in Northern Ireland. These 33 organisations represent 10% of all higher education providers in the UK.
The highest number of responses from a single organisation was 273 teaching staff (7% of their total teaching staff population) and the mean number of responses was 93 per organisation (on average 10.5% of the total number of teaching staff in each organisation that participated). However, six of the 33 organisations contributed fewer than 20 responses.
A survey indicating the digital experience of further education teaching staff was run simultaneously and results can be found on our 2023/24 further education teaching staff report page.
Through Jisc’s digital experience insights service, organisations can gain valuable data to inform strategic, operational and digital investment decisions, evidence year-on-year improvements and demonstrate return on investment. Organisations that take part have access to their own data to assess their unique situations as well as benchmarking data. Full information about the digital experience insights surveys is detailed on our information page.
Executive summary
Our 2023/24 digital experience insights survey for higher education teaching staff asked questions that explored the overall experience of teaching using digital technologies. Core questions, asked each year, allowed us to gain insights into the environment for teaching using digital technologies, information about the activities and modes of teaching that higher education staff engaged in, and data about the support offered to help teaching staff make effective use of digital tools in their teaching. Staff from 33 organisations across the UK shared their experiences.
This year’s survey indicated that teaching staff continued to value and employ a wide range of digital technologies made available to them by their organisations. They used these tools in both in person and online/off campus contexts. For many, digital technologies complimented their existing teaching styles, and were seen as tools to help them improve student engagement with course content. However, the survey results revealed that staff needed more support from their organisations: with more opportunities for digital upskilling, by professional services staff with the capacity themselves for supporting the effective embedding of digital technologies in courses of study, and by reliable infrastructure and devices. In some areas of teaching staff’s digital experience, positive ratings declined in this year’s survey compared to previous years. However, by reflecting on the quantitative data as well as the in-depth feedback offered by teaching staff when asked for their positive and negative experiences, opportunities for improvement can be identified by universities.
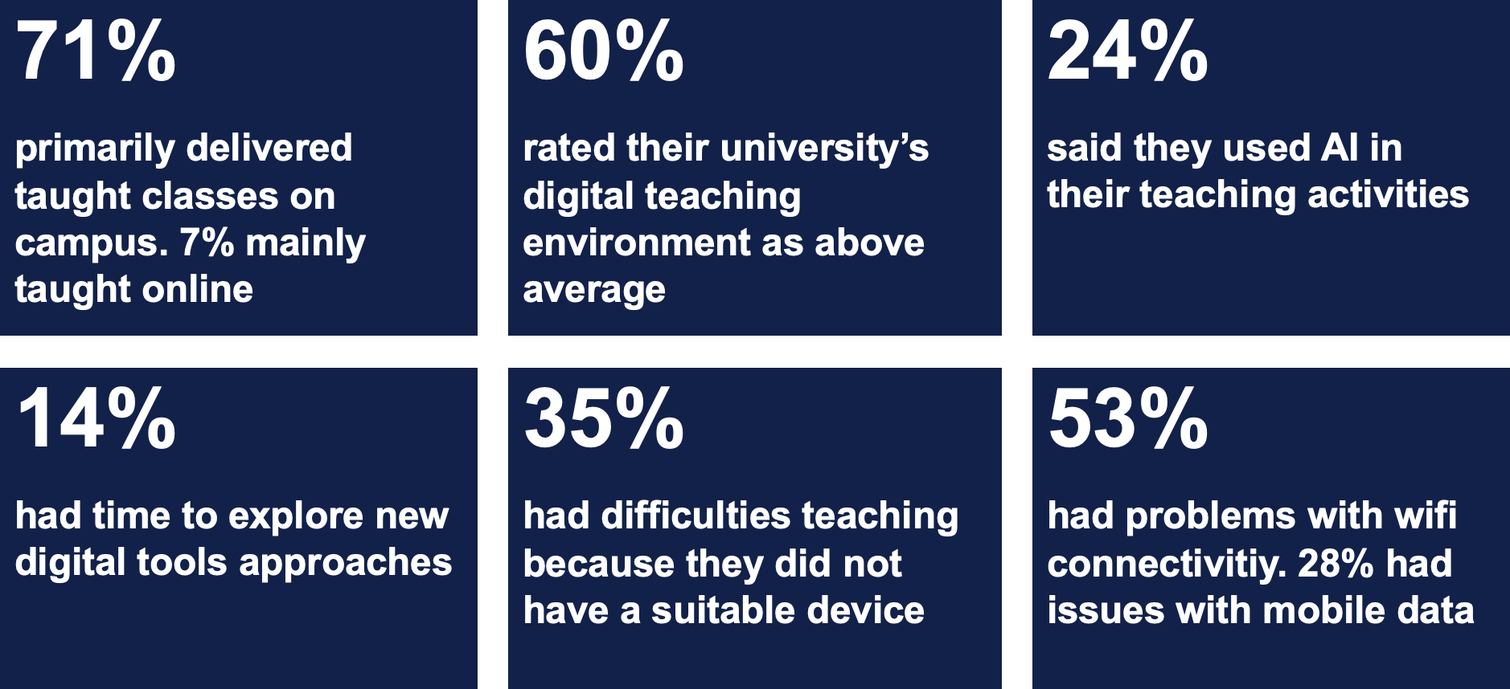
Three-fifths (60%) of survey respondents considered the digital teaching environment offered by their organisation to be above average (best imaginable, excellent or good). This represents a slight decline from last year’s survey (64% above average). Some staff clearly experienced problems in their teaching activities – and in their other responsibilities – because of unsuitable devices and unreliable infrastructure. Nearly a quarter (23%) said they were not given, loaned or offered help to buy a device for teaching. Over a third (35%) reported problems in teaching because of a lack of a suitable device. Furthermore, some teaching staff said they had to buy their own devices and peripherals since the ones provided by their organisation were not fit for purpose (eg low specification or did not meet personal preferences). Teaching staff also faced issues with various infrastructure elements, including wifi connectivity (53%), mobile data access (28%) and systems access (41%).
As in last year’s survey, the location of teaching shifted further towards mainly on campus teaching (71% this year, 67% last year). However, staff employed a wide range of digital technologies in their teaching beyond the online delivery of live or recorded lectures. Yet, few teaching staff felt they had the time to explore digital tools and approaches (14%). When asked to talk about their experiences of teaching using digital technologies, many also said they simply did not have the time to invest in professional development around digital skills. Others said that support or training was either not offered or it was unclear where to find out about training opportunities. Indeed, the percentage of teaching staff who reported that training was offered in a wide range of digital skills areas was low. This is an area that needs to be addressed by universities: either by expanding the provision of training where possible or by improving awareness of existing offerings.
We asked about artificial intelligence (AI) for the first time in this year’s survey. Only around 13% of teaching staff said they were provided with AI systems, chatbots or virtual assistants by their organisation, but about a quarter (24%) said they used AI in their teaching activities. About a fifth (18%) had been offered training in the appropriate use of AI tools.
Full report
Download our 2023/24 UK higher education (HE) teaching staff digital experience insights survey findings [pdf].